Norai for Studies & Consultations provides specialized services in atmospheric studies and comprehensive air pollutants analysis in the State of Kuwait. The service applies advanced statistical analysis and Geographic Information Systems (GIS)to produce accurate, scientifically sound analyses that support technical studies, academic research, and informed decision-making.
The scope of work includes the analysis of all air pollutants, without limitation to primary or commonly monitored pollutants, and is defined based on the objectives of each study and the client’s specific requirements.
Scope of Analysis
The analysis scope includes, but is not limited to:
-
Particulate matter of various sizes
-
Gaseous air pollutants
-
Volatile and organic compounds
-
Secondary pollutants formed through atmospheric reactions
-
Pollutants associated with industrial, traffic-related, and natural activities
Methodology
Norai applies a structured and scientific methodology in conducting atmospheric and air quality studies, including:
-
Descriptive and advanced statistical analysis
-
Temporal and spatial analysis
-
Multivariate statistical analysis
-
Correlation and regression analysis
-
Geographic Information Systems (GIS)
Deliverables
-
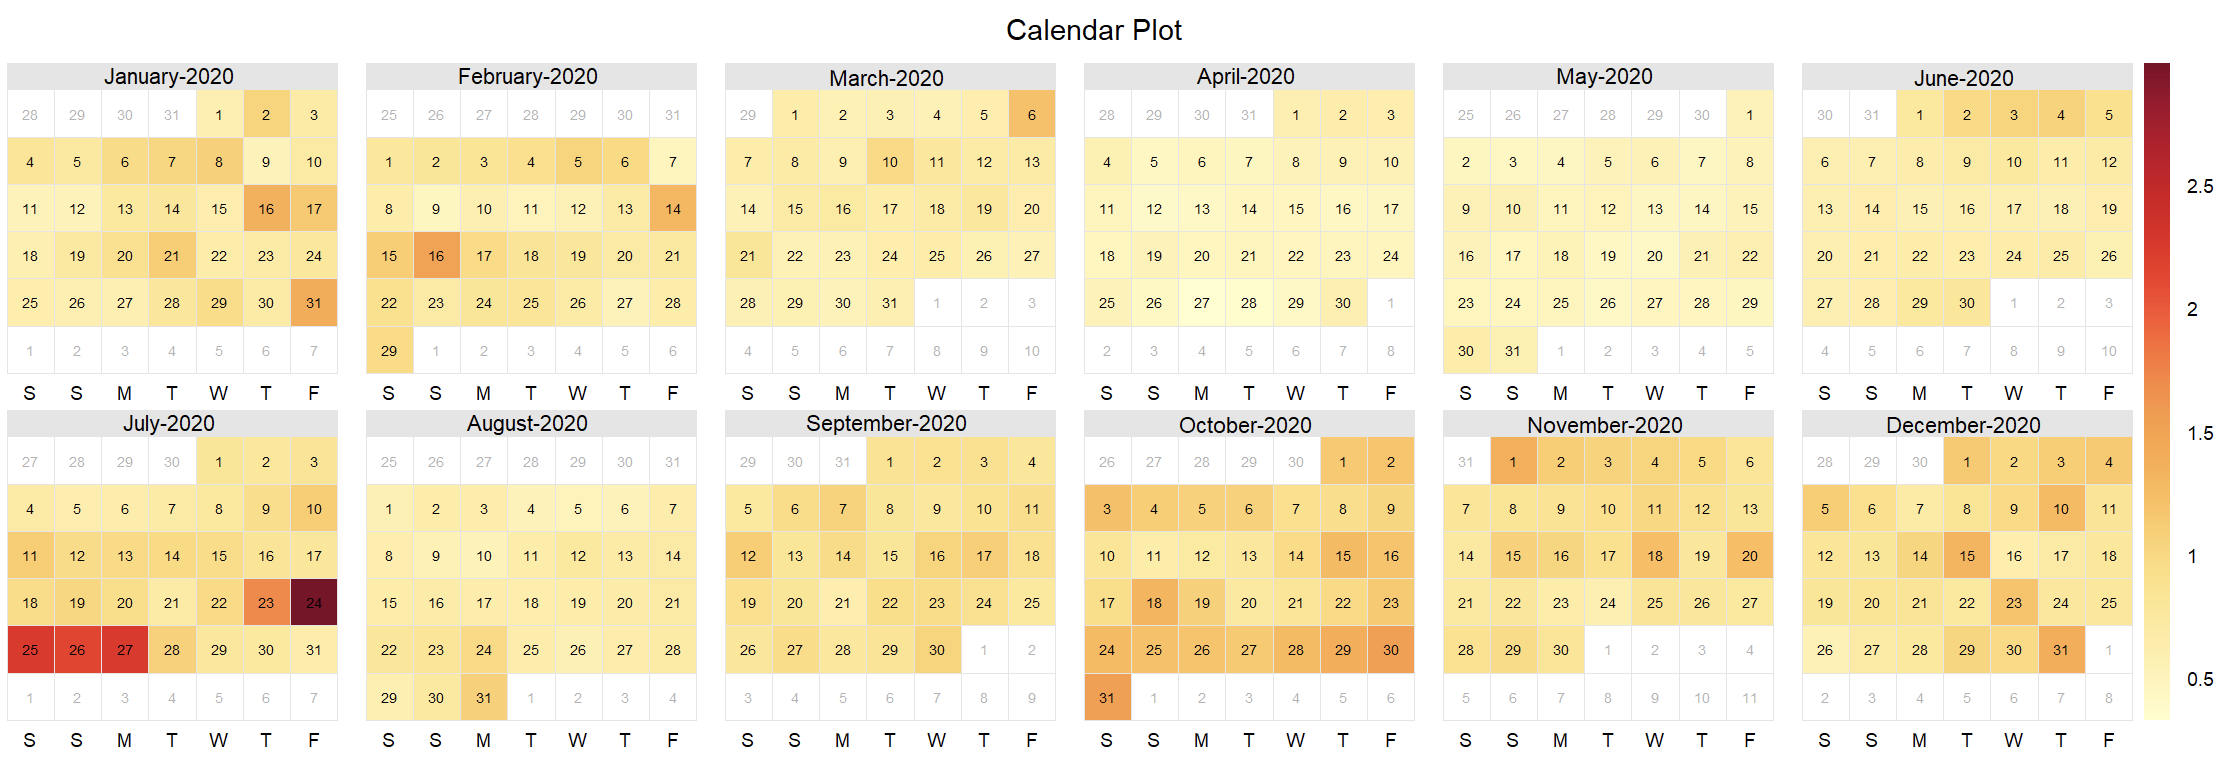
Original analytical charts and visualizations
-
Accurate and interactive GIS-based maps of the State of Kuwait
-
Quantitative indicators suitable for comparison and assessment
-
Technical and research reports ready for direct use
All charts, maps, and visual outputs are generated internally by Norai for Studies & Consultations and are fully owned by the company.
Target Beneficiaries
-
Private sector companies
-
Engineering and consulting offices
-
Universities and research institutions
-
Graduate and postgraduate students
-
Digital and analytical platforms
Why Norai?
-
Comprehensive analysis covering all air pollutants
-
Integration of statistical analysis with GIS technologies
-
Clear scientific methodology and analytical rigor
-
Professional, application-ready outputs
Contact Us
For specialized atmospheric studies or technical consultations:
info@noraikw.com
Random Sample Data


